

Stop me if you’ve heard this one before. “I can get you a 300% increase in click through rates with our new software tool.” Have you sat in those wonderful reporting meetings with the presenter pointing at the screen, with a pretty graph that shows an arrow point up and to the right? Sure, there’s a metric there (web traffic, clicks, open rate percentage…) but can that presenter tie that metric back into real business value?
I’ll never forget the CEO of the first for-profit business I worked for – every time we put together a bigger marketing budget, he always responded with, “Every time I give you money, you go spend it but I don’t see anything in return.” I had charts showing growth – email opens, click throughs, the whole nine yards. But we didn’t get the increased budget, because the CEO didn’t value email opens. He valued the bottom line.
Sales and marketing professionals know the game: the numbers don’t lie. But we can make the numbers prove any story we want to sell. The truth in your digital marketing activities – in any marketing activity – is not in the chart that goes up and to the right, but in what value is attached to that growth, and how your marketing tactics and reporting breaks down to real business value.
In this post we’ll discuss how to approximate a lead value, how to compare lead value to the cost of marketing activities, and how this should be reflected in your marketing reports. First, we’ll dive into the math that makes CFOs happy, and gives marketers the tools for great reports and an easier sell of the next campaign. We’ll start with some simple questions about our customer and our sales process.
What’s my Lifetime Value of a Customer?
This first question is perhaps the toughest of all, and the one where executives have to be 100% truthful and real with their executors. How much is each customer worth?
There are lots of ways to judge the effectiveness of business activities, but for marketing activities, calculating your Return on Ad Spend (RoAS) can be one of the best in order to quickly quantify and qualify your activities. It’s not ideal for viewing the bigger picture, but it’s perfect for getting a tactical view of what’s working, what’s not, and where to optimize.
Figuring out your average lifetime value of a customer is the first step in figuring out how effective your marketing activities are by tying them back to business impact. How much does your product or service cost each customer? Is there an average number sold per customer? Do they commonly subscribe to your product or service for any duration, or is it a “one and done” sell?
Adding up these factors helps you figure out what one customer is worth to your business. Now, you have the end value in mind to which you can compare activities.
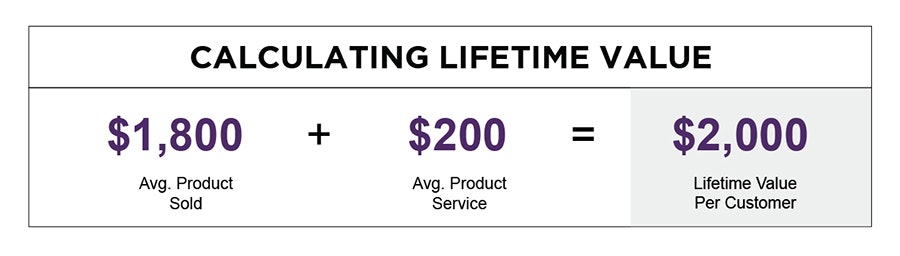
For example, say your business sells luxury watches. The average customer will spend $1800 on a watch and another $200 in maintenance or repair over the product’s lifecycle. Using your product sold ($1800) plus your average cost of maintenance and repairs at your store (one visit at $200), you’d figure an average Lifetime Value of $2000 for that customer.
How many Marketing Leads does it take to get a Customer?
Now that you know how much a customer is worth, you can figure out how many “leads” it takes to get to that customer. This can be fairly easy or very complex, depending on your sales process and how you track sales and marketing activities.
A simple way to think of this is to define Sales Qualified Leads (SQLs) and Marketing Qualified Leads (MQLs) for your organization. An example SQL definition could be any lead that leaves Marketing’s responsibility to nurture and becomes assigned to Sales to close, usually based on a certain probability of its potential to close. An MQL for that same company might be any contact that’s taken significant action on a marketing activity – that is, giving you their information such as name, email, and/or phone number – but that is not quite qualified to hand off to a salesperson yet.
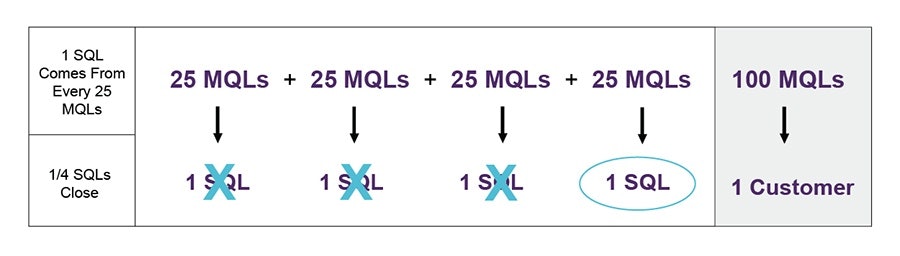
Using our above Luxury Watches example, say 1 in 4 SQLs – defined as a “lead that requests a quote, catalog or phone call” – closes to become a customer. You also figure it takes 25 MQLs to produce 1 SQL – in this case, defining an MQL as any conversion that captures prospective customer information (but doesn’t request a quote, catalog or call). Using simple math, you can figure out it takes 100 MQLs for your luxury watch business to equal one customer.
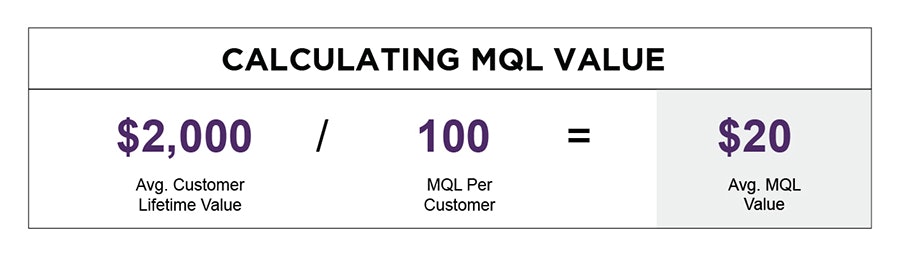
You can then figure your average MQL lead value by dividing your average customer’s lifetime value by the average amount of MQLs it takes to earn one customer. In our above example, we’d divide our Luxury Watch Customer’s average lifetime value of $2000 by 100 (the average number of MQLs it takes to earn a customer) to get an average lead value of $20.00.
Now in any lead generation campaign or marketing activity we run for our Luxury Watch company, we can estimate the average value of every lead to be $20.00.
What’s my Cost Per Lead for each Marketing Activity, Campaign or Channel?
What does this all have to do with measuring marketing activities? Now that we know what the average lead is worth, we can start to calculate RoAS – with one more piece of information. We can and should always keep track of how much our marketing activities cost, be they larger campaigns or a single focused project. From those activities, we’re also hopefully tracking how effective they are by how many leads they deliver (or, in some cases, by the traffic they deliver to our websites, storefronts, etc., or in a harder to track awareness or sentiment metric).
Figuring out our Cost Per Lead for a marketing activity, channel or campaign becomes as simple as dividing the cost of that activity by the amount of leads it generated. This is a much better valuation for lead generation campaigns with limited duration (although it could be applied to longer-term marketing activities, like SEO, if a longer duration is used to analyze the campaign, since such activities take a much longer time to produce leads).
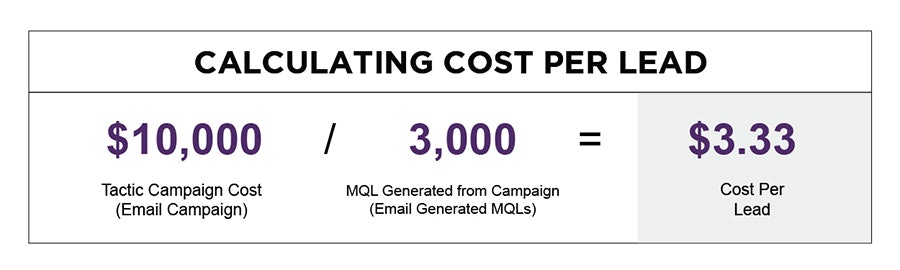
Let’s return to our luxury watch example. Our company has decided to run a 3 month email marketing campaign. After the costs of email creation, landing page setup, workflow and automation setup, and other necessary work, we arrive at a cost of $10,000 for the entire email campaign.
At its conclusion, we’ve tracked that over the course of the campaign, we delivered 3,000 MQLS – leads where a prospective customer took some action on our website and gave us some information.
We divided our campaign cost ($10,000) by our leads delivered during that campaign (3,000) to get an average lead cost of $3.33.
Return on Ad Spend (RoAS): The Executive Metric
Was our campaign successful? We delivered leads for $3.33 – compared to the $20.00 lead value (based on the effectiveness of our sales activities to close prospects and our lifetime customer value) – so we got a Return on Ad Spend of 6 times what was spent on the campaign.
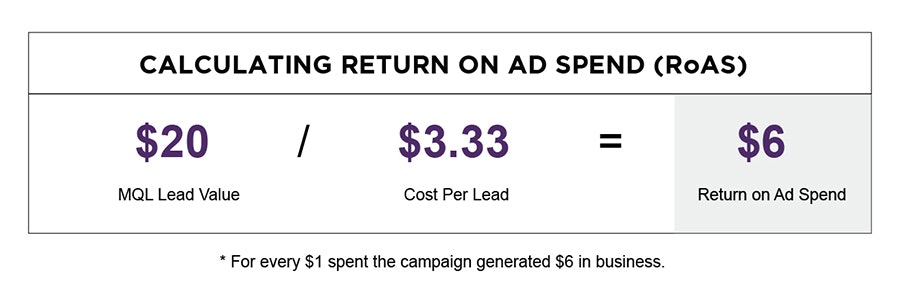
What would you rather report on as a marketer? That you had 20% open rate, a 5% click through rate, and delivered 3,000 leads… or that for every dollar spent, you earned your company $6? Apply that to the campaign – for $10,000, we generated $60,000 in business. That’s the kind of campaign that has CEOs and CFOs coming back for more.
All of these metrics are good things to understand, to track, and to report on. But any marketing report should lead with the RoAS. That’s the executive headline.
What’s Next?
You can take reporting on your marketing activities even further by comparing the bottom line business value of each activity against one another, or by breaking down the Cost Per Lead of each channel used in your campaigns and breaking down the individual channel RoAS. This can be dangerous across ALL marketing activities, especially non-lead generation-focused activities – for one thing, not all channels are created equally and aren’t always used the same way (by companies or by prospects). For another, it’s not likely that one activity was the sole driver of turning a prospect into a customer – one email does not usually a customer make. Rather, it’s the combined efforts – and exposure – of several marketing activities and channels that add up to a sale.
But over time, and over several campaigns and marketing activities, you’ll start to see which activities generate better RoAS than others. You can also use this as a means to measure improvement. NOW your open rates matter, because the endgame is not a higher open rate, but a higher RoAS for your email campaigns.
Meet the Bottom Line – and Exceed It
If your marketers – internal teams, agencies, and companies trying to sell you on the next big thing – aren’t tying things back to your bottom line, they’re doing it wrong. There’s a dozen different ways to calculate and value marketing. But within your marketing efforts, you absolutely must begin tracking activity, measuring it against the value of each customer, and analyzing its effectiveness in terms of cost per activity versus the value it returns in leads.
And that CEO who would never give me the updated marketing budgets? He wasn’t wrong. It’s not that we weren’t doing great things with our marketing. It’s that he didn’t care about open rates, banner click-throughs, and paid impressions. If I only knew then what I know now.
Put in the work to value your customers, your leads, and your activities. Lead with the bottom line. The opportunities it will afford you to be truthful with your marketing efforts will pay for the work tenfold – both in ways to show measured improvement in your work, and ways to get paid to do more.